Football
Michael Carrick's Man United collapse: The stats behind his sacking
A selection of the most remarkable stats that highlight just how steep the fall has been for Michael Carrick at Manchester United.
Anirudh Menon ·
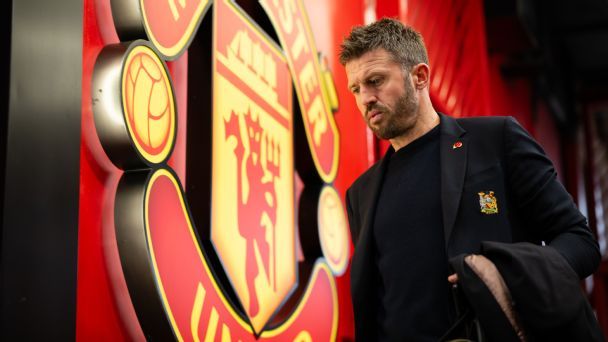
Michael Carrick has been sacked as Manchester United manager after their worst start to a top-flight season since 1972-73 (just one win in 10 Premier League games), leaving them languishing in the relegation zone.
Carrick had a remarkable start to life as United boss, on an interim basis taking over from Rubern Amorim, but since being appointed permanent manager the results have been shambolic.
Just five months ago, he signed a contract until 2028 with an option to extend for one more year.
Here's a selection of the most remarkable stats that highlight just how steep the fall has been for Carrick this season:
The decline in Man United wins under Carrick
The disparity in Carrick's reign as interim manager in the 2025-26 season and permanent boss in 2026-27 is remarkable. Last season, Carrick won 12 matches of 17 (three draws, two losses), while this season he's won just three matches across all competitions (five draws, seven losses). There are more stats that highlight that disparity:
- Goals per game: 1.9 last season vs. 1.6 this season.
- Goals against per game: 1.1 last season vs. 2.0 this season.
- Clean sheet percentage: 35% last season vs. 7% this season.
A winless run leaves Man United in relegation zone
15 - With the international break coming right after that rollercoaster draw vs. Aston Villa which consigned United to 18th, the club will spend at least 15 consecutive days in the relegation zone, their most since September/October 1986 (28 days).
8 - United are on an eight-game winless streak in the Premier League, tying the club's longest winless streak in the competition.3 - 2026-27 has been the joint-fourth worst start in Manchester United's long history. In their first 15 matches across all competitions, they won just three games (five draws, seven losses). They only fared worse in 1930-31 (one), 1972-73 (two), 1892-93 (two).
Carrick's points-per-game and win rate at Man United
In 27 Premier League matches under Carrick, United have the third most points in the league among ever-present clubs in that same period.
He's also got the fourth most points-per-game in the Premier League of any United manager post-Sir Alex Ferguson with 1.74 points per game with only Jose Mourinho (1.89), Ole Gunnar Solskjaer (1.81) and Louis Van Gaal (1.79) gaining points at a better rate....
Carrick's win rate in all competitions is 47% -- only sixth-best for a permanent manager in the post-Fergie era. Only Ruben Amorim fares worse with a win rate of 38%.
In the Premier League, Carrick's win rate is 48%, ahead of Ralf Rangnick (42%) and Amorim (32%).
Man United's problem with clean sheets
It's the first time since 1986-87 that United have failed to keep a clean sheet in any of their first 10 league games of the season. In fact, they are the first side to finish in the top three of the top-flight and then keep no clean sheets in their first 10 games of the next season since Liverpool in 1966-67.
In yet another incredible disparity, United rank first for the most shots taken on goal (193) but are ranked 18th (0.091 xG) for xG per shot. They are also 16th for shot conversion rate (7.3%) and on-target efficiency (28%).